The Value of Mapping Vertical Obstructions
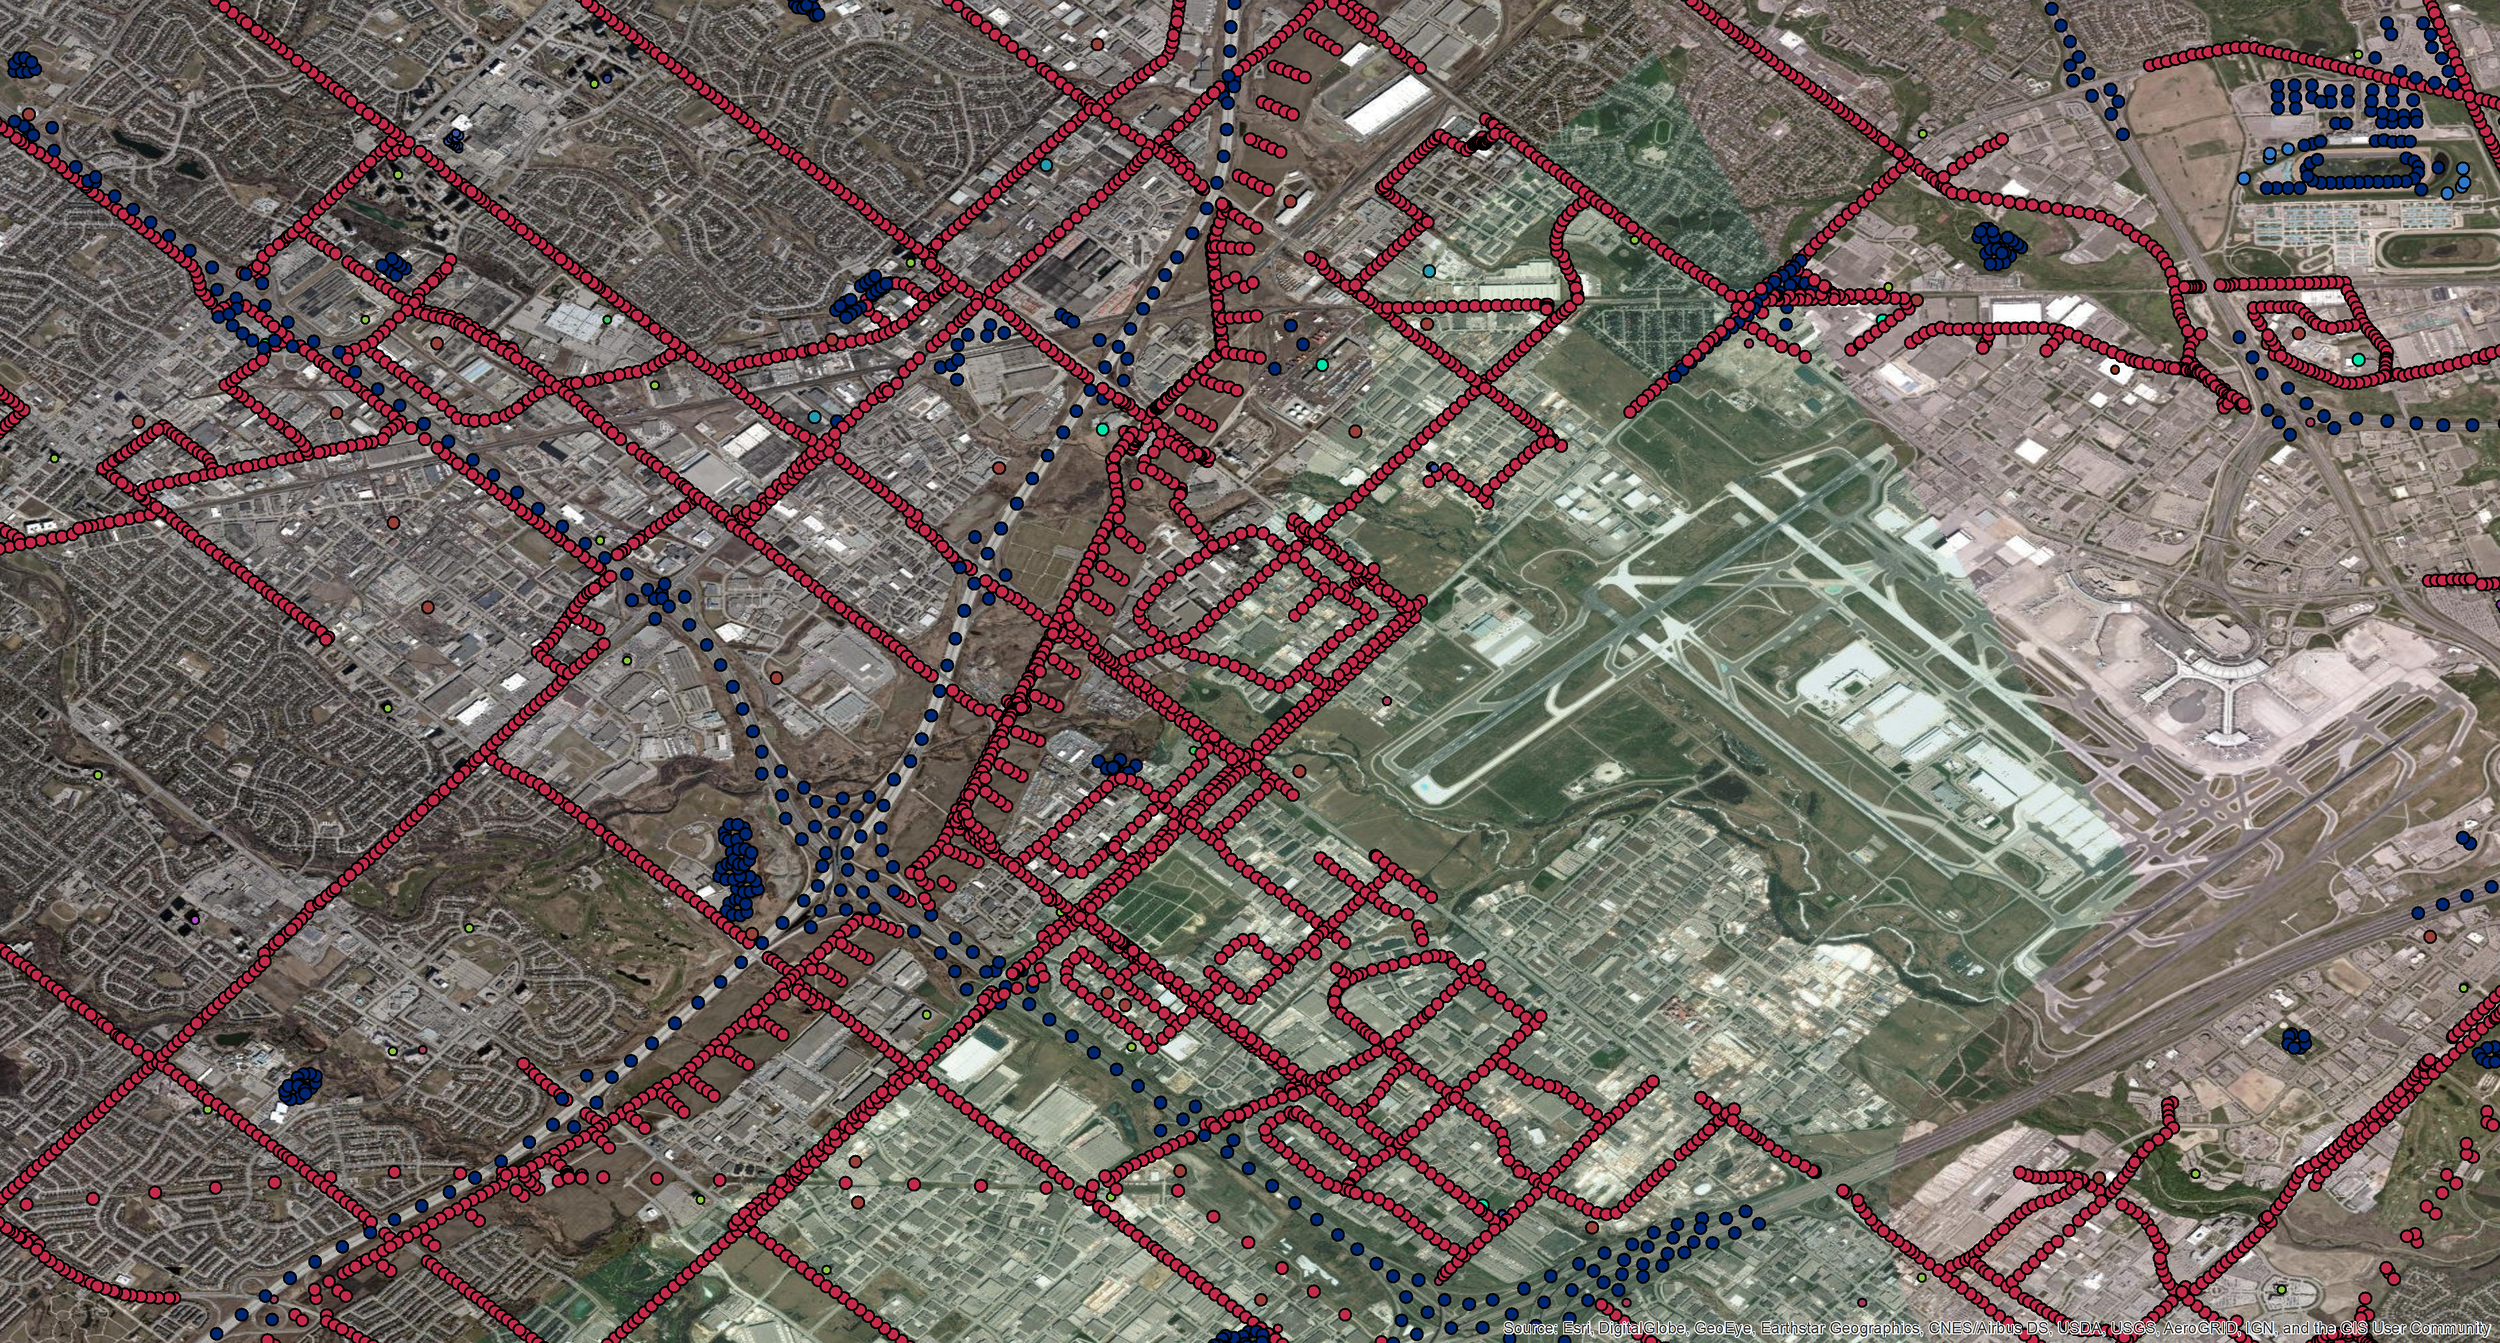
We have been locating, documenting, and mapping vertical obstructions for one of our many customers. As a retired US Air Force C-130 Navigator I flew low level missions at 300 feet almost every day. I know the value of knowing where your vertical obstructions are located before you go fly. We recently worked on an area with an incredible amount of new obstructions. The red dots on the above screenshot represent powerline pylons and the blue dots represent light standards either along roads or within athletic areas. Every dot on the map represents an obstacle that is taller than 50 feet. Most are between 50 and 100 feet, but there are occasional vertical obstructions that reach up to 1,000 feet or more. Those could ruin your fun day of flying whether you are in a C-130 or a Cessna 172. We use a VerticalGeo proprietary process to determine the location and height of each vertical obstruction, increasing the accuracy and quality of the data we create. For safety of flight reasons it is imperative to know where these obstacles are. The work we do eventually makes it into FAA and DoD flight charts to help promote safety of flight.

